If you’re running Google Ads but unsure whether they’re truly working, you’re not alone. Many small business owners and even experienced marketing managers struggle with the same question: What numbers actually tell me if my PPC campaigns are successful?
That’s where PPC KPIs—or Key Performance Indicators—come in.
These are the metrics that help you see what’s working, what needs improvement, and where your money is going. Think of them as your campaign’s health check-up.
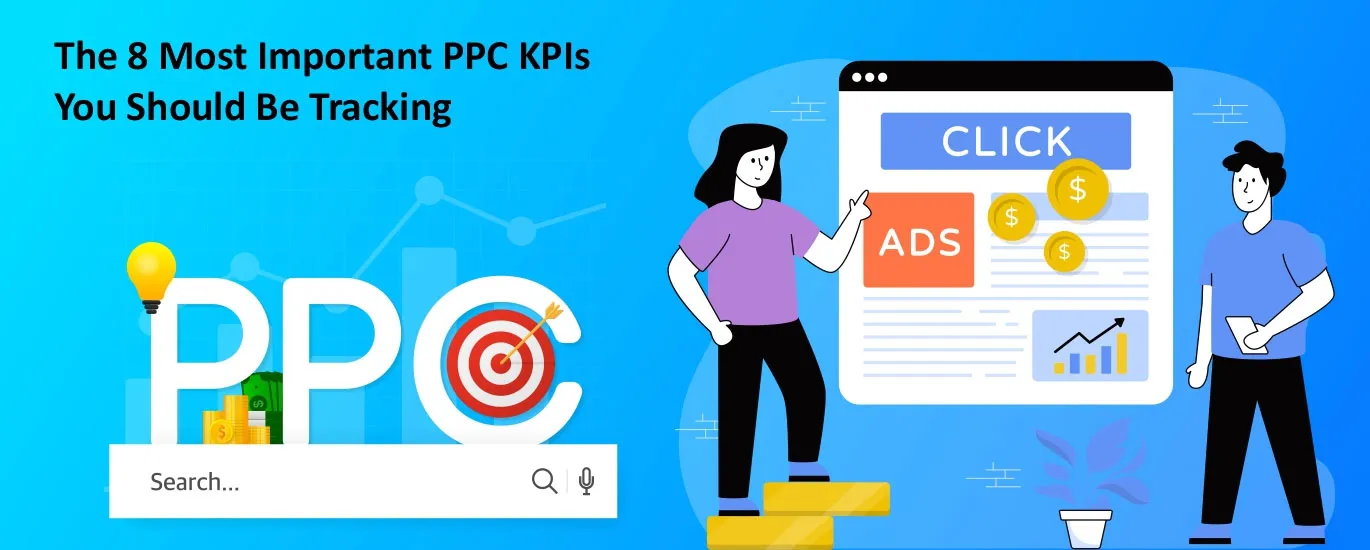
In this blog, we’ll walk you through the 8 most important PPC KPIs you should be tracking. Whether you’re new to Google Ads or trying to improve your performance marketing efforts, these insights will help you make better, smarter decisions.
1. Click-Through Rate (CTR)
What it is:
CTR = (Clicks / Impressions) × 100
It shows the percentage of people who saw your ad and clicked on it.
Why it matters:
A high CTR means your ad is relevant and appealing to your audience. It’s often the first sign of a healthy campaign.
How to track it:
Available directly inside your Google Ads dashboard under the “CTR” column.
Benchmark:
A good CTR in Google Ads is usually above 2%, but this can vary by industry.
2. Conversion Rate (CVR)
What it is:
CVR = (Conversions / Clicks) × 100
It tells you what percentage of users who clicked on your ad actually took the action you wanted—like filling a form, calling, or buying something.
Why it matters:
CTR tells you they’re interested; conversion rate tells you they’re convinced.
How to track it:
You’ll need conversion tracking set up in Google Ads or Google Analytics. Use Google Tag Manager if needed.
Benchmark:
A solid average conversion rate is between 2% to 5%, depending on the industry.
3. Cost Per Click (CPC)
What it is:
CPC = Total Spend / Total Clicks
It’s how much you pay each time someone clicks your ad.
Why it matters:
Lower CPC means more traffic for your budget. However, cheap clicks aren’t always quality clicks, so balance is key.
How to track it:
Check the “Avg. CPC” column in Google Ads.
Benchmark:
Average CPC in Google Ads ranges from ₹20 to ₹150+ in India, depending on the niche.
4. Cost Per Conversion (CPC or CPA)
What it is:
CPA = Total Ad Spend / Number of Conversions
This tells you how much it costs to get one customer or lead.
Why it matters:
It’s one of the most critical Google Ads KPIs. Even if you’re getting tons of clicks, if conversions are too expensive, you’re wasting money.
How to track it:
Use conversion tracking in Google Ads and review the “Cost/Conv.” column.
Benchmark:
Aim to keep CPA lower than your average customer lifetime value (CLV). For local service businesses, a CPA under ₹500–₹1000 is often acceptable.
5. Impression Share
What it is:
It’s the percentage of times your ad was shown out of the total possible times it could have shown based on targeting and budget.
Why it matters:
If your impression share is low, you’re missing potential customers, either due to budget limitations or ad rank issues.
How to track it:
Available in Google Ads under “Search Impression Share” and “Display Impression Share.”
Insight:
An impression share above 70% is a good sign that your ads are competitive.
6. Quality Score
What it is:
A score from 1 to 10 Google assigns based on your ad relevance, expected CTR, and landing page experience is called Quality Score.
Why it matters:
Better Quality Score = Lower CPC and Higher Ad Rank.
How to track it:
In Google Ads, add the “Quality Score” column at keyword level.
Insight:
Try to maintain a Quality Score of 7 or above for your key keywords.
7. Return on Ad Spend (ROAS)
What it is:
ROAS = Revenue Generated / Ad Spend
It tells you how much return you’re getting for every rupee spent.
Why it matters:
It directly answers the question: Is this profitable?
How to track it:
Track revenue through conversion tracking with value or eCommerce tracking in Google Analytics or Google Ads.
Benchmark:
A ROAS of 4:1 means you earn ₹4 for every ₹1 spent—generally a healthy target.
8. Bounce Rate (from PPC Landing Pages)
What it is:
The percentage of users who land on your site and leave without doing anything.
Why it matters:
A high bounce rate indicates a disconnect—maybe your landing page doesn’t match ad expectations or is too slow.
How to track it:
Use Google Analytics. Filter traffic by Google Ads campaigns.
Insight:
Aim for a bounce rate below 50%. Optimize landing pages for clarity, speed, and relevance.
Why Tracking These PPC KPIs is Crucial
Without KPIs, your Google Ads campaign is flying blind. You might be spending a lot but getting little in return—or missing major growth opportunities.
Tracking these 8 PPC KPIs gives you:
- A clear picture of what’s working
- Power to fix issues quickly
- Data to make profitable decisions
- A roadmap for scaling performance marketing
When you know your numbers, you can scale smarter, not harder.
Ready to Maximize Your PPC Results?
At Arrowpace, we don’t just run ads—we build performance marketing campaigns that drive real results. Whether you’re a startup or a growing brand, our experts help you track the right KPIs and turn your ad budget into actual business growth.
Let’s take your PPC strategy to the next level with smarter insights and proven results.
Talk to Arrowpace – Your Trusted Performance Marketing Agency.
Final Tip: Don’t try to monitor everything at once. Start with 2–3 KPIs that matter most to your business goals, then build from there.


